Introduction
Last weekend I decided to take a deeper look at the famous SQLite 35% Faster Than The Filesystem benchmark. I didn't want to do a shallow read of the post. I wanted to compile the kvtest tool and run the experiments myself and see what is going on. I recommend doing that, specially if you want to follow along with the blog post.
While running the read experiments, something caught my attention. It seems that to see good performance results using SQLite, you have to run kvtest twice discarding the first run results. So the first run is used to load data into the cache, and the second and following runs take advantage of that. That makes sense but for some reason that intrigued me a bit and became curious to understand more about what was happening between the first and second run.
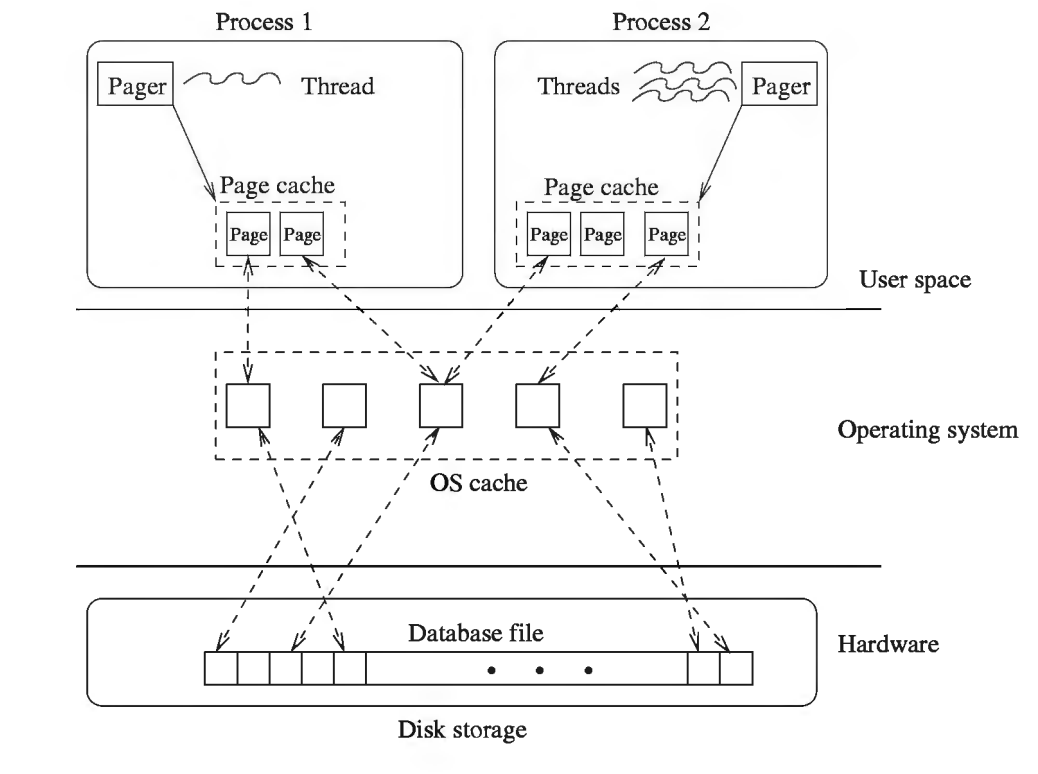
The first question that popped into my mind was: what kind of caching is happening here? I understand that SQLite has its buffer pool implementation that caches pages into memory. But, it's clear that the performance does not come from that since the kvtest program is completely finished after the first run. In the second run, the buffer would start empty (I suppose). So, the only place left for caching is in the Operating System. That reasoning gained more credibility when I saw the Figure 1 image from SQLite Database System: Design and Implementation book:

To confirm that I wanted to tinker with the disk page cache. In the search to figure out how I could pin or evict pages from the cache, I ended up, founding an awesome tool called vmtouch.
Confirming that the OS is caching the SQLite data
- Let's first purge the OS page cache:
sudo purge(inMacOs, inLinuxit seems thatecho 3 > /proc/sys/vm/drop_cachesdoes the trick) - Calling
vmtouch test1.dbtells that0%oftest1.dbis cached
>> vmtouch test1.db
Files: 1
Directories: 0
Resident Pages: 0/65579  0/1G  0%
Elapsed: 0.001622 seconds- Running the test, then running vmtouch again
>> kvtest % ./kvtest run test1.db --count 100k --blob-api
SQLite version: 3.39.4
--count 100000 --max-id 100000 --asc
--cache-size 1000 --jmode delete
--mmap 0 --blob-api
Database page size: 4096
Total elapsed time: 2.140
Microseconds per BLOB read: 21.400
Content read rate: 467.2 MB/s


>> vmtouch test1.db
		   Files: 1
     Directories: 0
  Resident Pages: 65579/65579  1G/1G  100%
Elapsed: 0.012271 seconds- You can see that our entire database is cached now. And that's why the second run is much faster.
- If you run
vmtouch test1.dbagain after some period of the first run you see a number smaller than100%, which means the OS has evicted some pages already. So the longer you wait to execute the second run, the worse the performance will be.
>> vmtouch test1.db
		   Files: 1
     Directories: 0
  Resident Pages: 51595/65579  806M/1G  78.7%
         Elapsed: 0.017729 seconds
Things you can try:
- Before executing the first run, put all of
test1.dbinto the cache by runningvmtouch -t test1.db, then execute the test. You'll already see good performance results in the first run; - You can execute the first run, evict all pages from the cache and execute again.
This confirmed that the performance is really coming from the OS disk page cache. And with that came, the question: isn't the OS caching the files in the FileSystem approach? If not, why?
Playing directly with the files
Now I've tried to understand what was happening with the cache when running the test directly on the FileSystem.
>> ./kvtest run test1.dir --count 100k --blob-api
--count 100000 --max-id 1000 --asc
Total elapsed time: 0.776
Microseconds per BLOB read: 7.760
Content read rate: 1282.1 MB/s


>> kvtest % vmtouch test1.dir
           Files: 100000
     Directories: 1
  Resident Pages: 1000/100000  15M/1G  1%
         Elapsed: 1.0113 seconds
Only 1% of the files were cached, after the first run. That is pretty interesting. It seems that the caching behavior of the OS is a lot different when accessing the blobs via SQLite than via FileSystem. What if I force the files to be in the cache? You can do that by using the flags -dl. You can see the percentages increase until it reaches 100% and it stays that way.
>> vmtouch -dl test1.dir
>> vmtouch test1.dir
           Files: 100000
     Directories: 1
  Resident Pages: 50115/100000  783M/1G  50.1%
         Elapsed: 1.159 seconds


>> vmtouch test1.dir
           Files: 100000
     Directories: 1
  Resident Pages: 78288/100000  1G/1G  78.3%
         Elapsed: 1.0382 seconds


>> vmtouch test1.dir
           Files: 100000
     Directories: 1
  Resident Pages: 95351/100000  1G/1G  95.4%
         Elapsed: 1.0803 seconds


>> vmtouch test1.dir
           Files: 100000
     Directories: 1
  Resident Pages: 100000/100000  1G/1G  100%
         Elapsed: 1.0232 seconds
Running the test again, we get similar performance results:
>> ./kvtest run test1.dir --count 100k --blob-api
--count 100000 --max-id 1000 --asc
Total elapsed time: 0.736
Microseconds per BLOB read: 7.360
Content read rate: 1351.7 MB/s
So not only does the caching behave differently in the FileSystem approach, but it also does not impact the performance.
Final thoughts
I'm not an OS expert and have no idea how the cache replacement policy of an OS works but seems reasonable to expect 100,000 syscalls to open and read from a file would have an impact on the cache behavior; and also how doing so many syscalls seems to make the caching insignificant. In the SQLite approach, you are doing that only once. The article is pretty good but the way the benchmark was set up may lead to wrong conclusions if you're not alert (not saying the article concluded things wrongly). Most of the performance comes from how the data was organized and accessed, which is usually a design decision a Software Engineer should make when targeting a use case.
Other than that, the greatest reward for reading the article was discovering vmtouch. Such a simple tool that enables awesome performance debugging. And also, I'm also in awe of how following your curiosity leads you to find things you could never have imaged before you started. One of the reasons I did not want to do a shallow reading on this article.
